Botanical & Ethnobotanical Representation
The 251 occurrence records derive from 48 African plant species across 26 taxonomically harmonized botanical families. Caricaceae (17.1%), Apocynaceae (15.5%), Moringaceae (14.3%), and Cucurbitaceae (13.2%) represent over 60% of all reports.
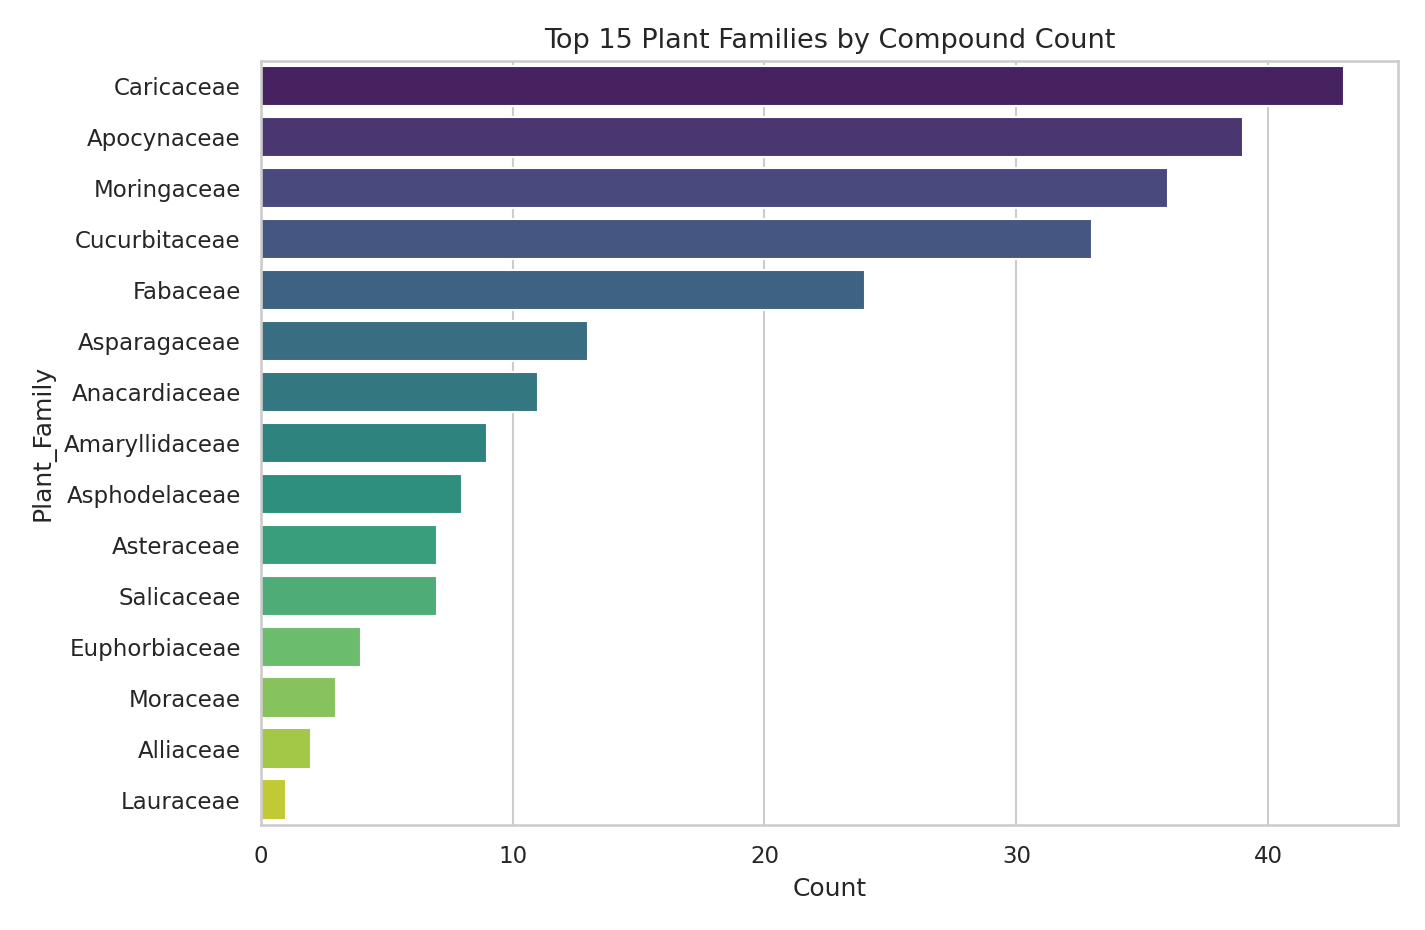
Bar chart of the top 15 botanical families by compound count, led by Caricaceae, Apocynaceae, and Moringaceae.
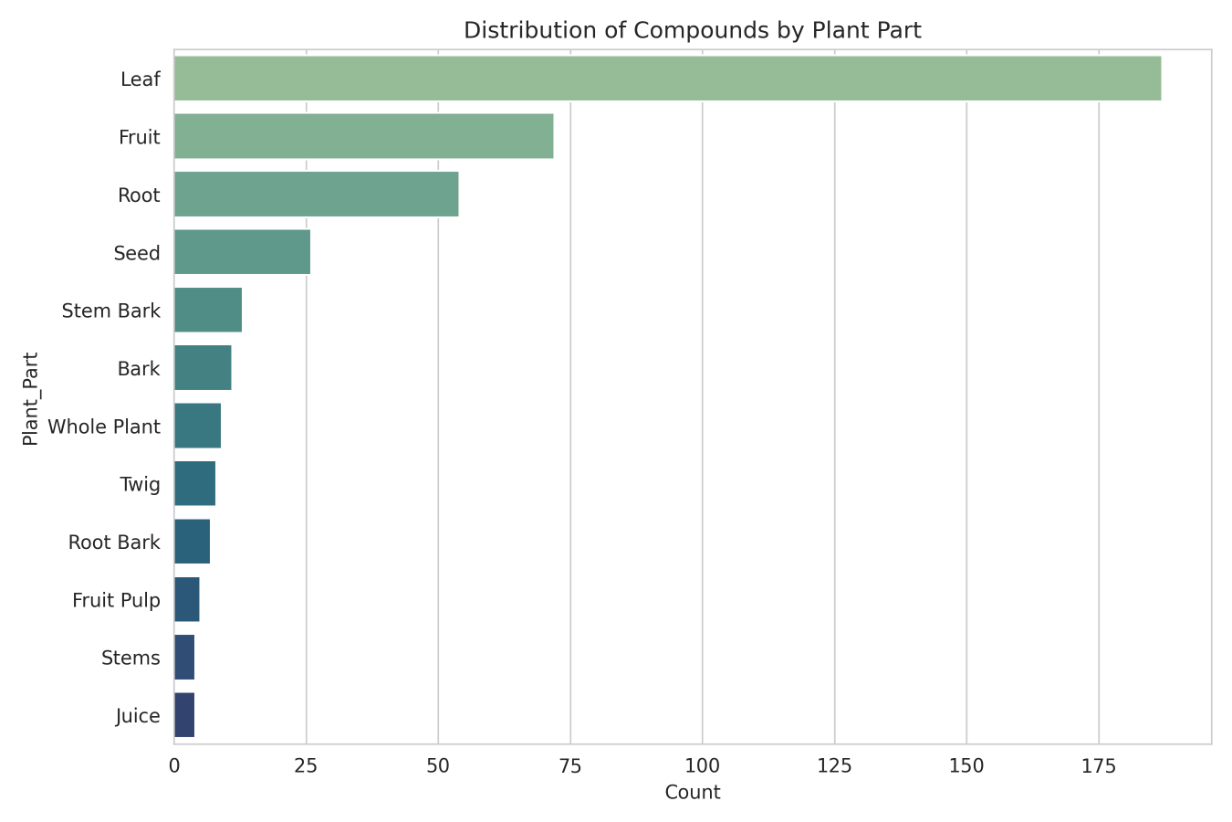
Compound distribution by plant part. Leaves account for 74.5% of records, followed by fruit (28.7%) and roots (21.5%).
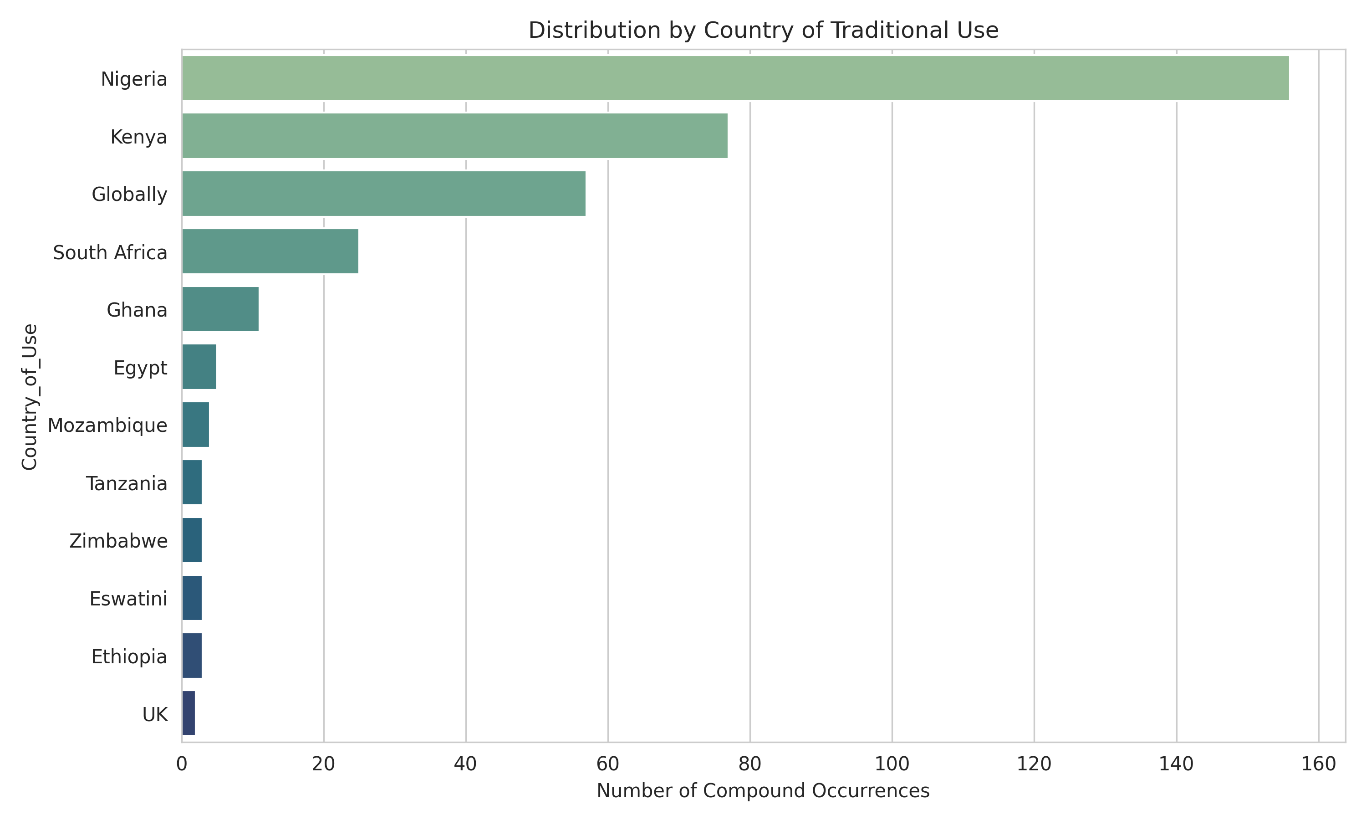
Distribution by country of traditional use across West, East, Central, and Southern Africa, with highest documentation from Nigeria and Kenya.
Phytochemical Superclasses
Flavonoids (33.1%) and phenolic compounds (20.7%) together comprise 53.8% of AfroDiabDB. Terpenoids (13.5%) and alkaloids (10.4%) constitute the next largest bio-active groups.
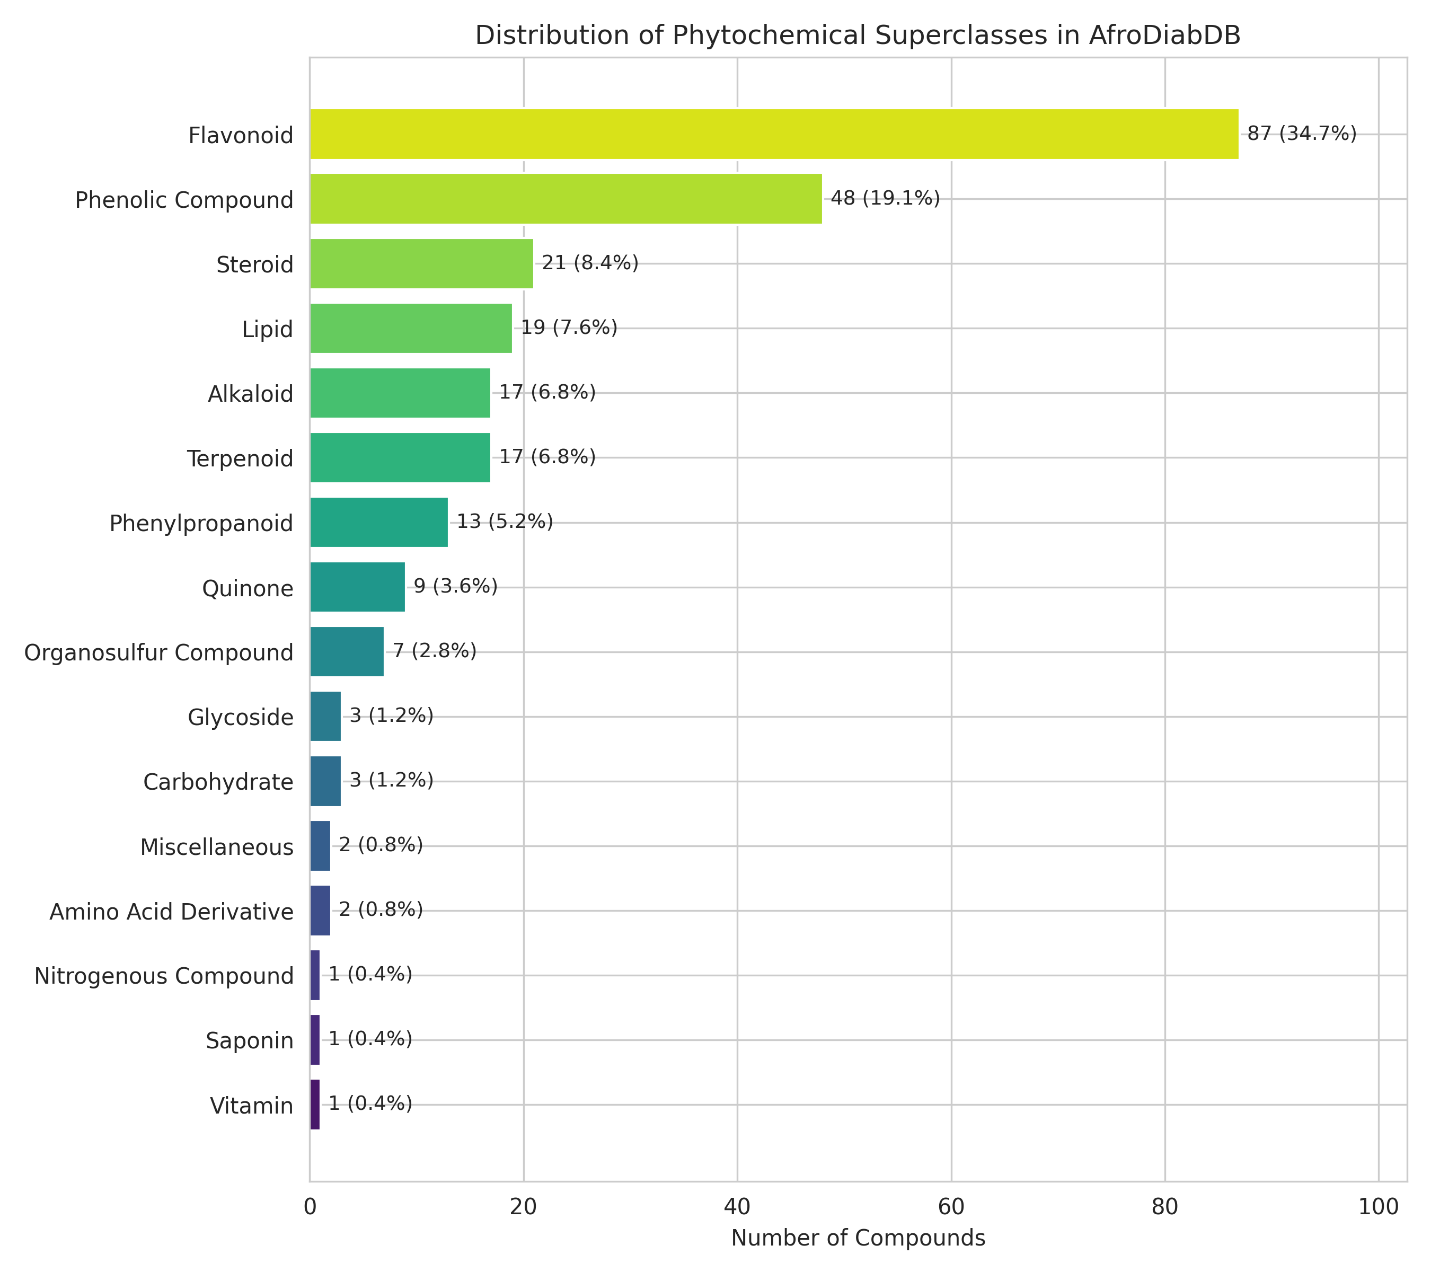
Phytochemical superclass distribution showing predominant representation of polyphenolic and flavonoid structures.
Therapeutic Mode of Action
The polyphenolic and flavonoid predominance mirrors the primary reported mechanisms of action in antidiabetic ethnopharmacology:
- Carbohydrate Hydrolysis Inhibition: Potent competitive and non-competitive inhibition of pancreatic α-amylase and intestinal α-glucosidase.
- Antioxidant & Anti-AGEs Activity: Scavenging of reactive oxygen species (ROS) and mitigation of advanced glycation end-products.
- Insulin Sensitization: Modulation of PPAR-γ and GLUT-4 translocation pathways in peripheral tissues.
Physicochemical Space & Drug-Likeness
Comparative analysis against 19 regulatory-approved antidiabetic drugs reveals natural products possess comparable mean molecular weights but exhibit greater conformational flexibility and polar surface area.
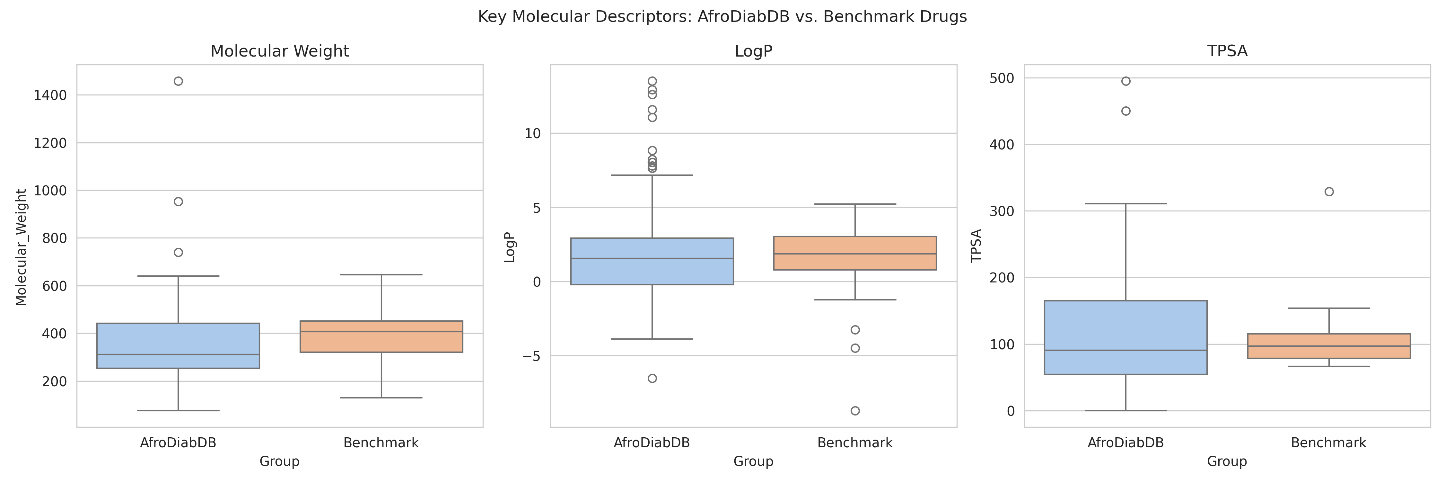
Boxplots comparing Molecular Weight, LogP, and TPSA distributions between AfroDiabDB (n = 201) and benchmark drugs (n = 19).
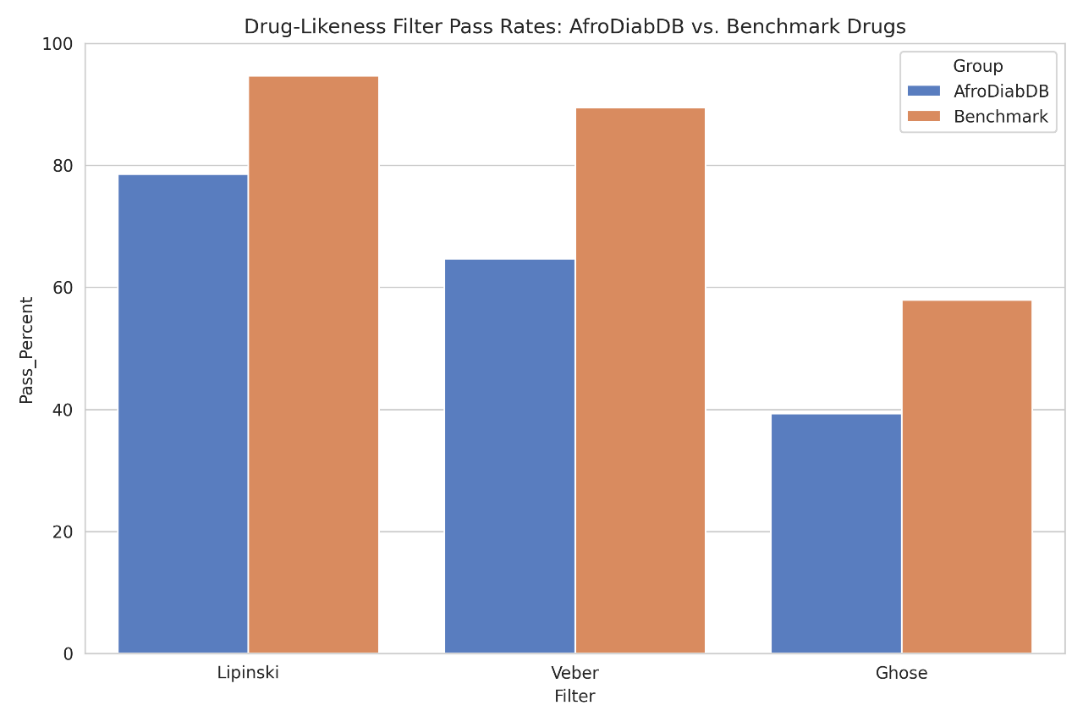
Grouped bar chart of filter pass rates across Lipinski's Rule of Five (67.2% vs 89.5%), Veber (73.1% vs 84.2%), and Ghose (52.2% vs 78.9%).
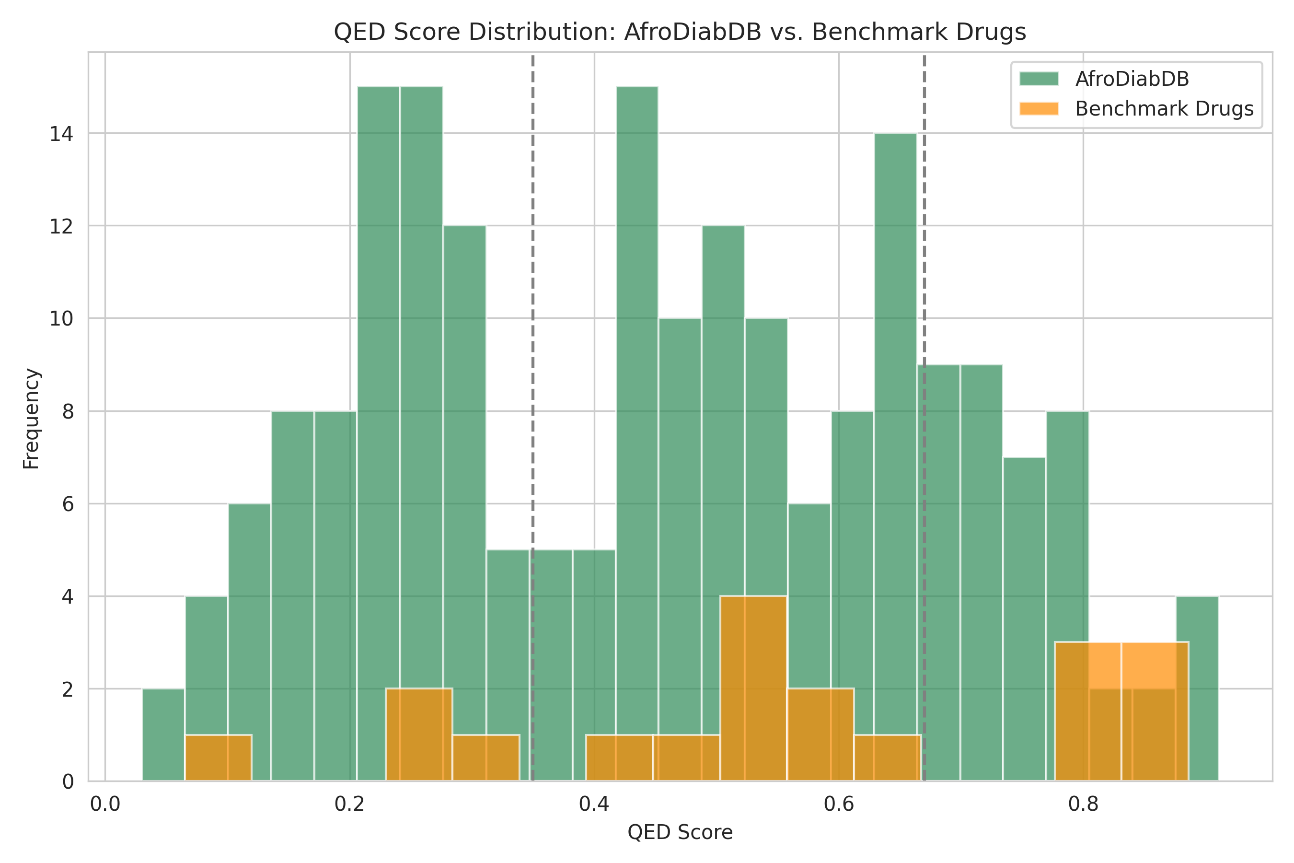
Histogram and kernel density estimate of Quantitative Estimate of Drug-Likeness (QED) scores for AfroDiabDB compounds (mean = 0.46).
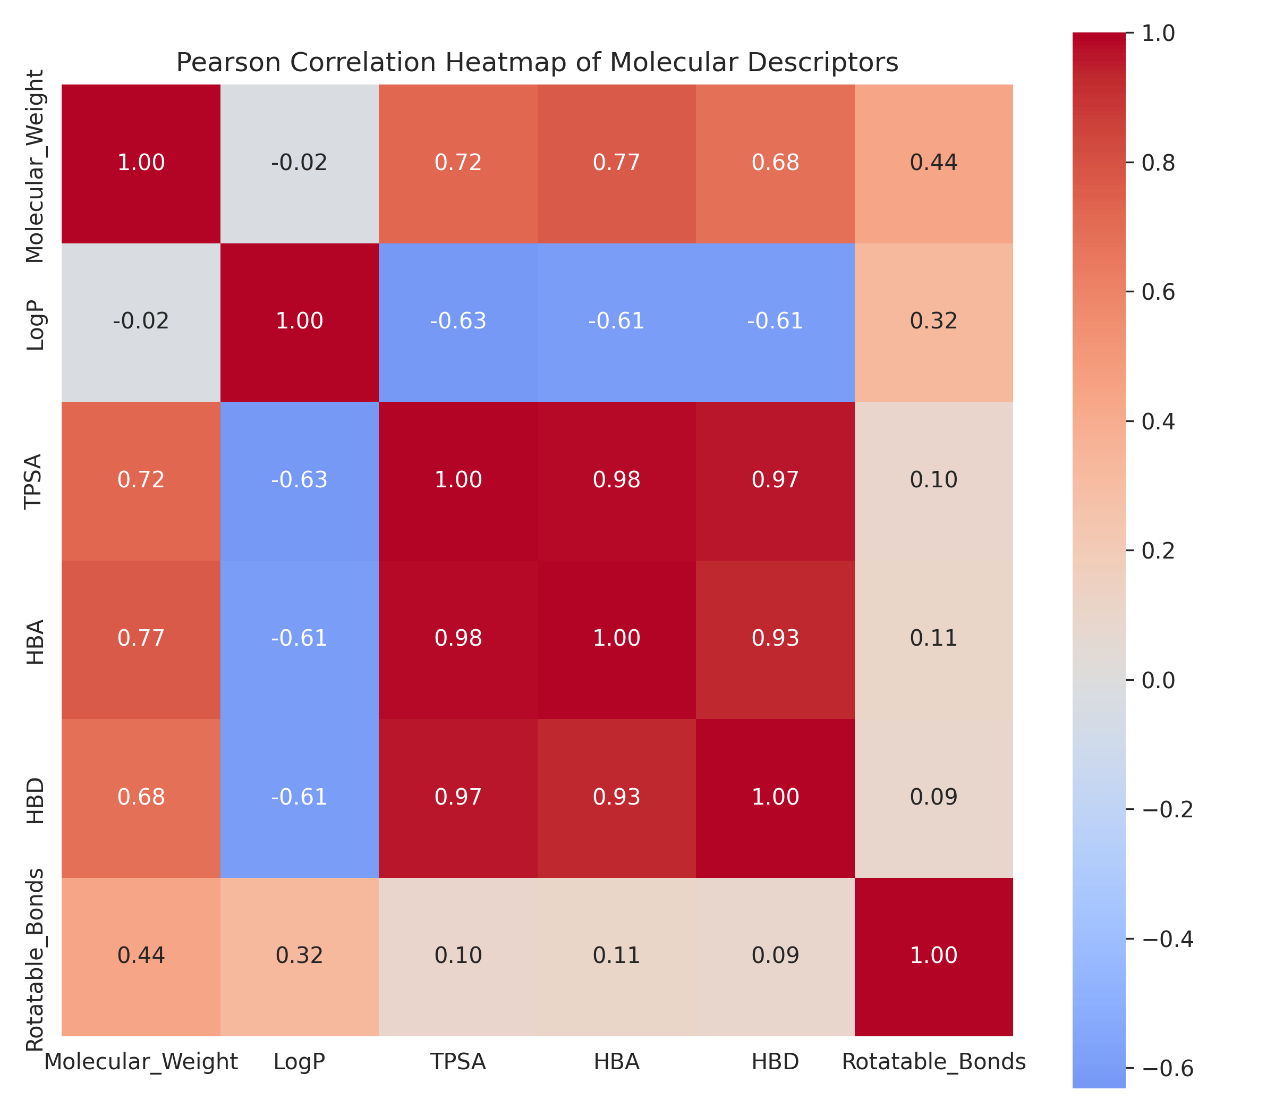
Pearson correlation heatmap of calculated molecular descriptors highlighting strong colinearities between MW, Heavy Atom Count, and Molar Refractivity.
Principal Component Analysis (PCA)
PCA conducted on 11 standardized molecular descriptors captures 65.4% of total chemical variance across PC1 and PC2, confirming that African phytochemicals occupy a unique and complementary chemical space relative to current synthetic pharmaceuticals.
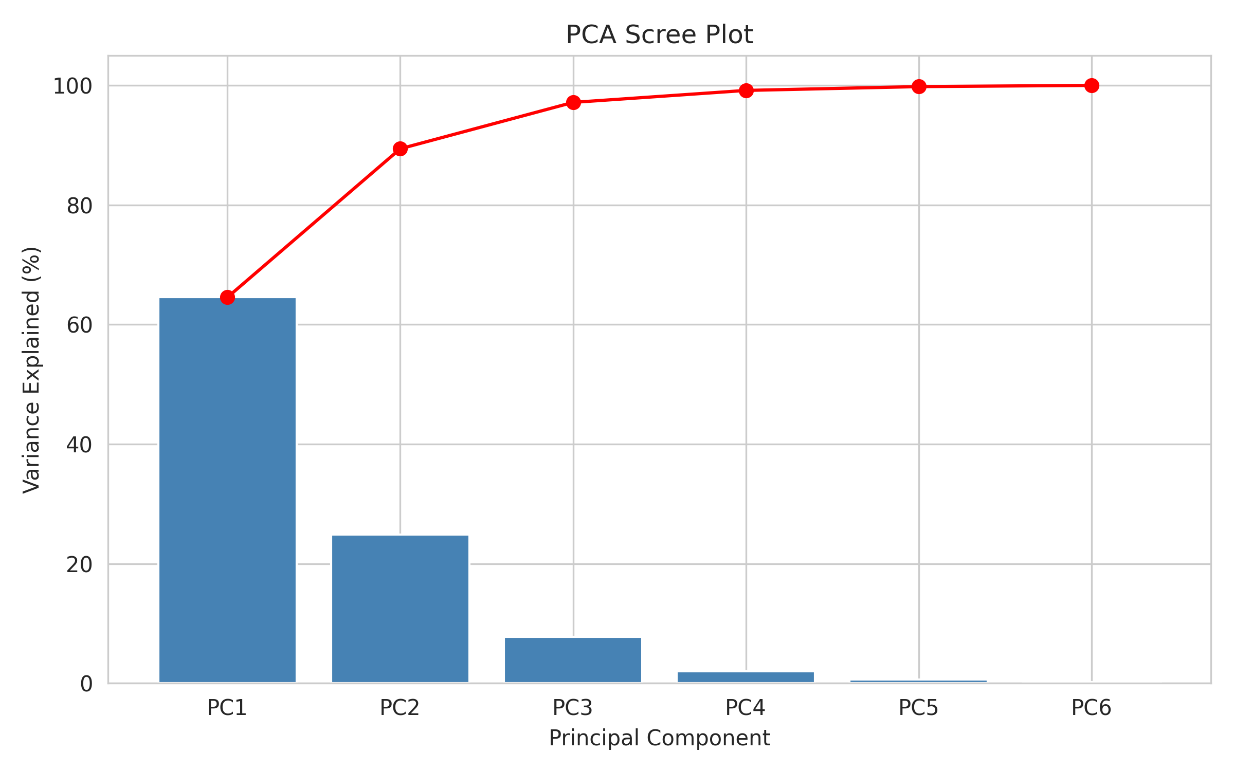
PCA scree plot displaying individual and cumulative percentage of variance explained by the top principal components.
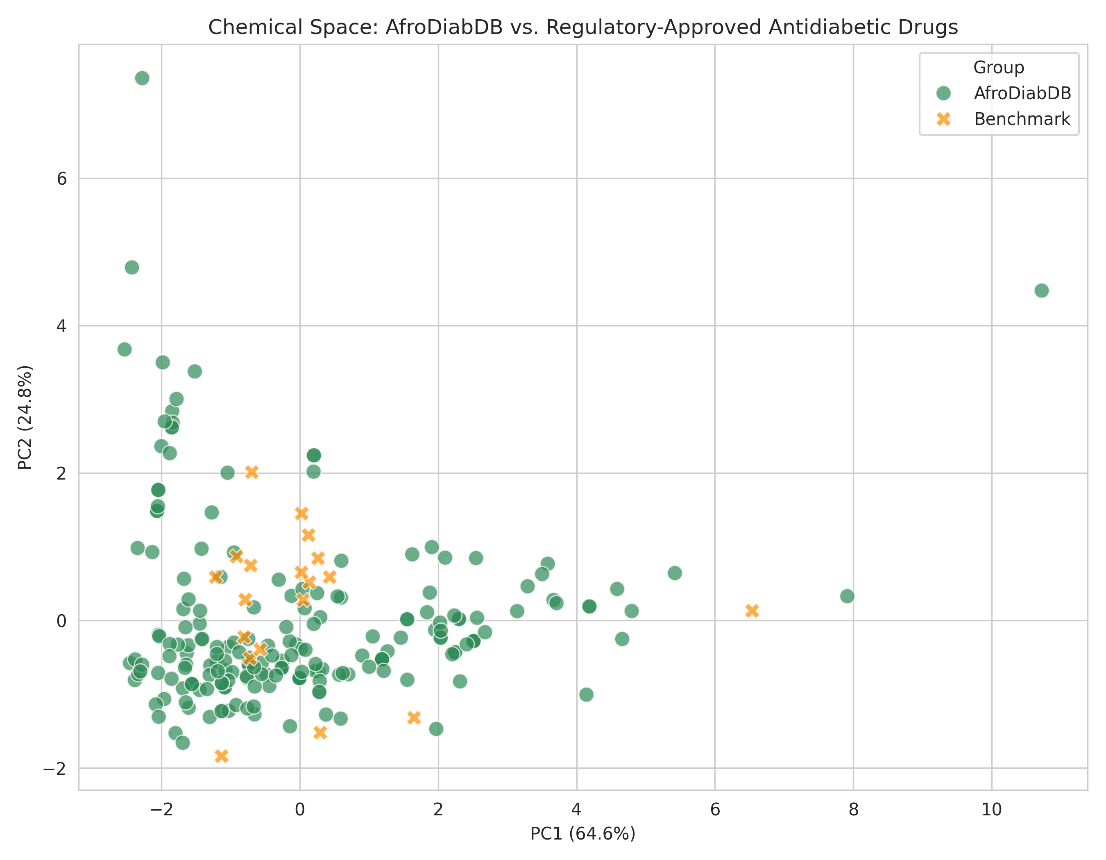
PCA score plot (PC1 vs. PC2) illustrating chemical-space overlap and structural divergence between AfroDiabDB compounds and approved antidiabetic drugs.
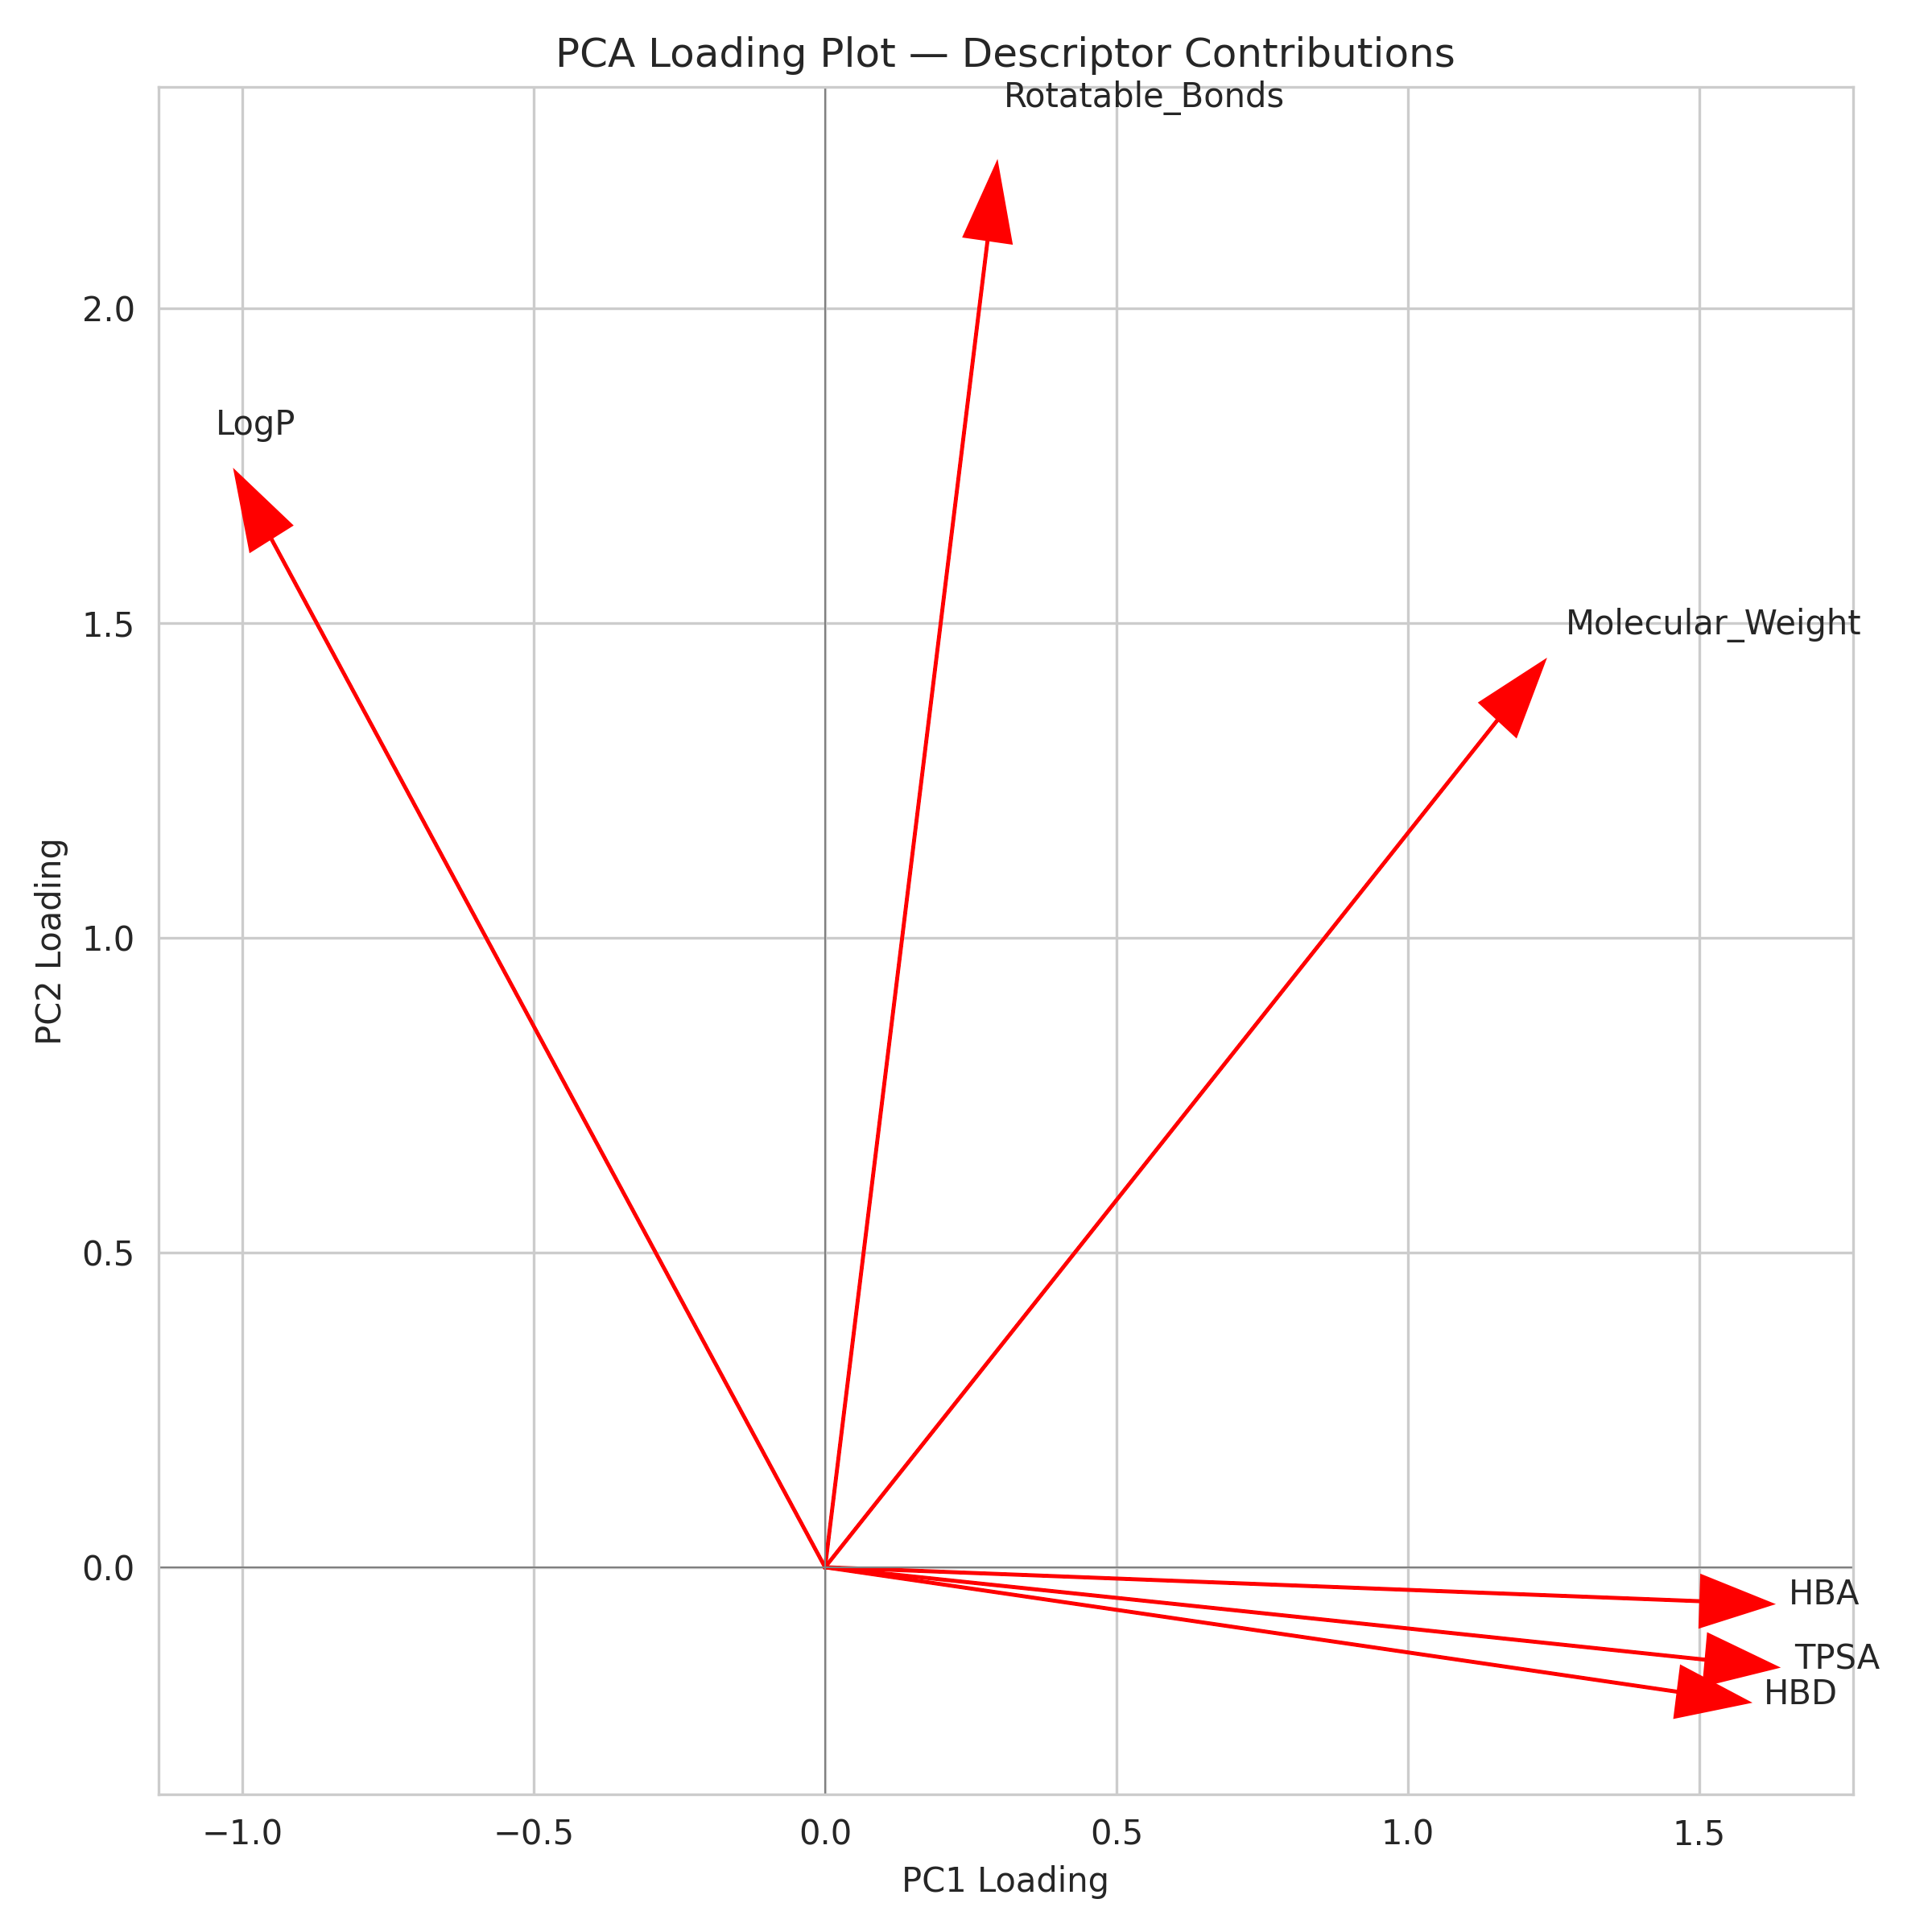
PCA loading plot showing molecular descriptor vectors and their directional contributions to PC1 (size/polarity) and PC2 (saturation/CSP3).
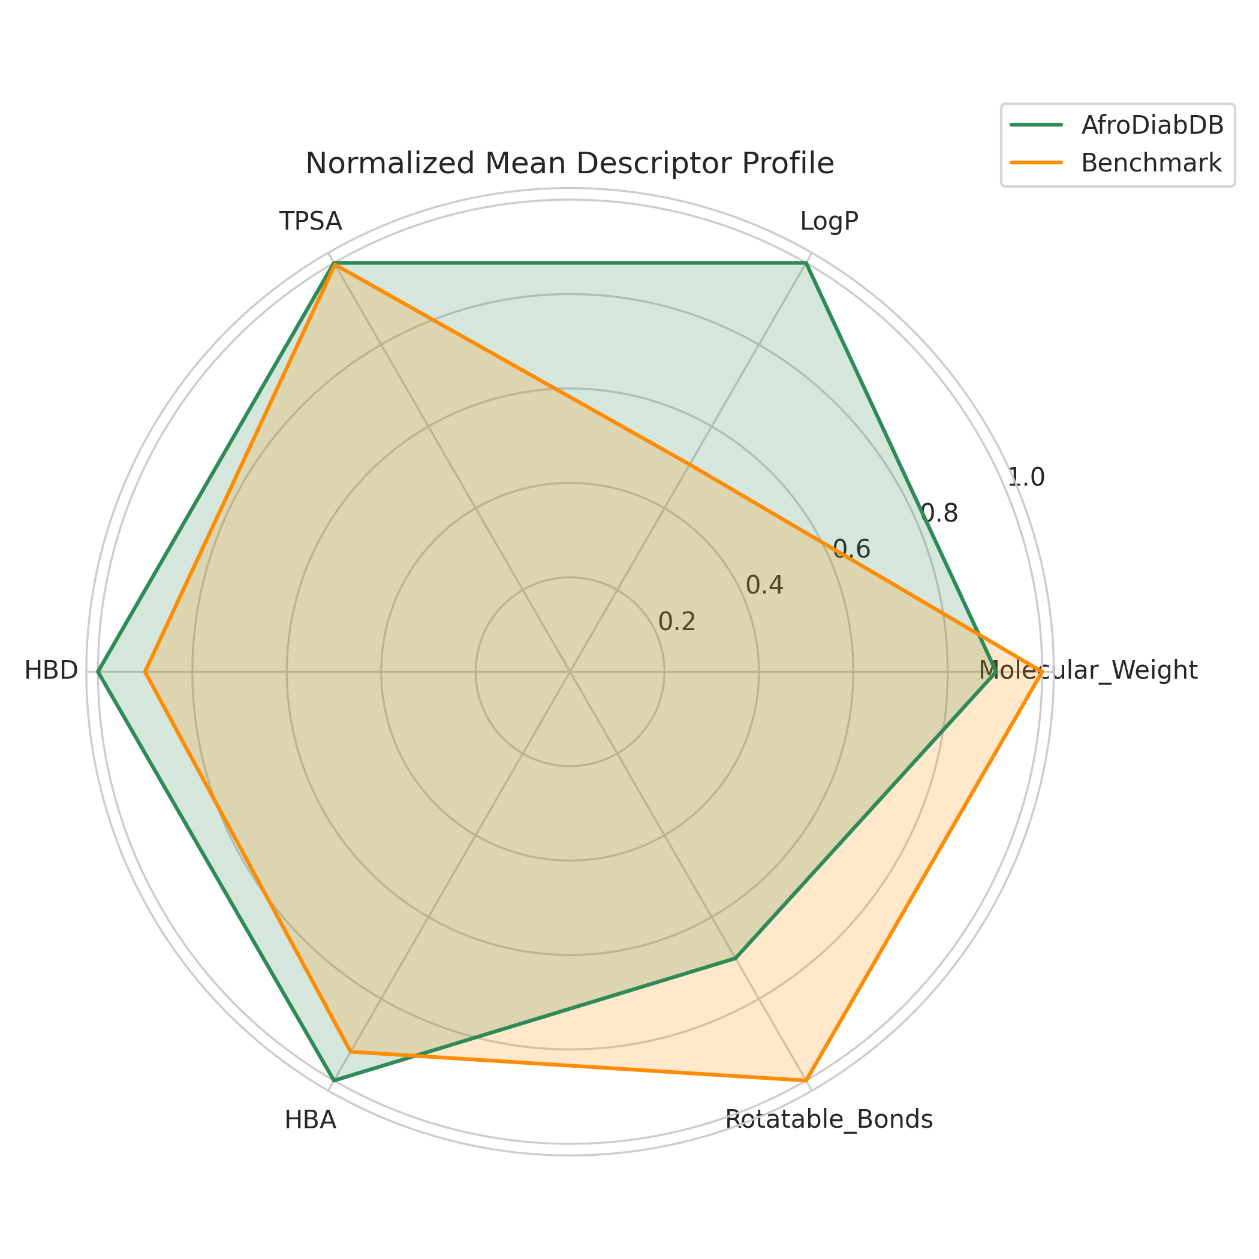
Radar plot of normalized mean physicochemical descriptor profiles, benchmarking African phytochemicals against FDA-approved antidiabetic drugs.